Insights metrics glossary
Overview
This document provides definitions for all the metrics in CircleCI Insights. You can review metrics in the Insights dashboard as well as the Insights API.
General metrics
General metrics appear across the Insights experience and can refer to different entities, depending on the context. For example, the Runs metric may refer to a count of workflow executions or jobs, depending on the context.
| Term | Definition |
|---|---|
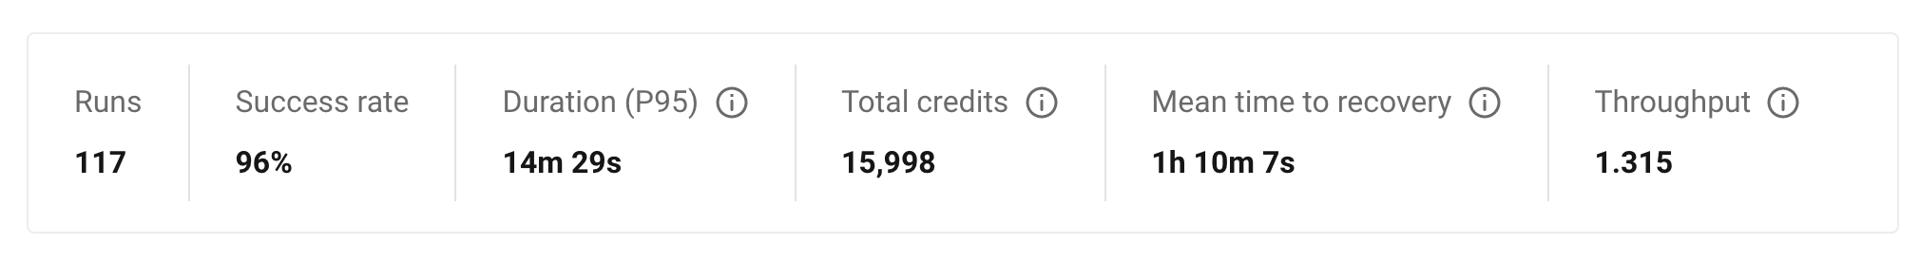
Runs | The count of executions in a selected time window. |
Total Duration | The sum of execution times for all workflows in a project. |
P95 Duration | The 95th percentile of execution times for an entity in a selected time window (i.e. 95% of runs completed in the same or less amount of this time). The 95th percentile is a standard measure used to interpret performance data. It provides a measure of max value when outlier or transient values are excluded. |
P50 (median) Duration | The median execution time. Medians are a better measure of central tendency than arithmetic means because they are more resilient to skewness in datasets. |
Total Credits | The sum of credits consumed during execution. |
Success Rate | The percentage of runs that completed successfully, excluding cancelled runs. Calculated by 100 x (Successful Runs / All Runs - Cancelled Runs) |
Organization-level metrics
Organization-level metrics allow you to analyze your organization’s performance.
| Term | Definition |
|---|---|
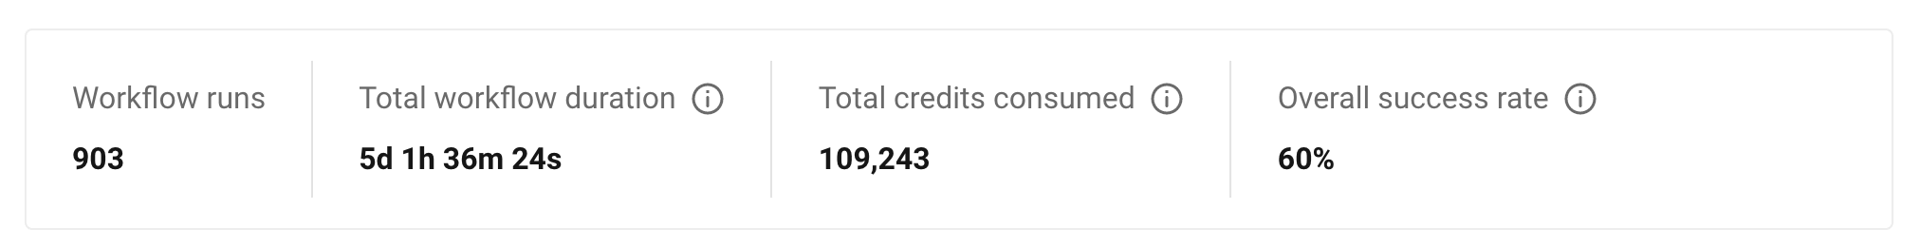
Workflow Runs | The count of all workflows executions for an organization for the selected projects in the selected time frame. |
Total Workflow Duration | The total execution time of all workflows runs for an organization within the selected projects and time frame. |
Total Credits | The total credits consumed across all selected projects in an organization. |
Overall Success Rate | The percentage of runs that completed successfully across all runs in the selected projects and workflows. Excludes cancelled runs. (calculated by 100 x (All Successful Runs/ All Runs - Cancelled Runs)) |
Workflow Metrics
| Term | Definition |
|---|---|
Time to Recovery | Total time spent in a failed state before a successful execution. |
Mean Time to Recovery (MTTR) | The average time it takes to get back to a successful execution from a failed one (Calculated by total recovery time / # of failures). If there are no failed builds (and thus no recoveries) in the current time window, the MTTR value will be empty. Empty MTTR values will be treated as 0 when calculating Trends. |
Throughput | The average (mean) number of builds of any status per day. Calculated by Sum of builds/ # of days. |
Trends
Raw metric values are often difficult to interpret on their own. Trends provide additional context to Insights metrics by presenting a relative benchmark against previous performance. For instance, on the last 7-day view, trends will display the change in value or delta compared to the prior 7-day window.
Trends displayed in the CircleCI UI are calculated as 100 * (current value - previous value) / prior-value.
Trends received from the CircleCI API are calculated as a ratio instead of a percentage with the following formula: (current-value / prior-value). These trends are 1-based and not 0-based.
- A ratio of 1.0 indicates no change.
- A value less than 1.0 indicates a negative trend, and a value greater than 1.0 indicates a positive trend.
- A value of -1.0 is an infinite trend.
This also applies to the following API endpoints:
Despite the trend being reported as a ratio via the API, the result returned is still effectively equivalent to the percentage that is shown in the UI. To compare the ratio from the API with the percentage reported in the UI, you can compute | trend-value - 1| (vertical line indicates absolute value). For example, if the API returns a ratio of 3.33, in the UI it will be shown as | 3.33 - 1 | = 2.33 which is equivalent to +233%.
Approximate Trends
For percentile metrics like duration, approximation methods are used to find the prior window benchmarks.
Duration
P95 Duration
For P95 duration, trends data is calculated by using the worst-case performance of the previous time window as a benchmark.
For example, to calculate the last 7-day trend information, Insights selects the worst/largest daily P95 duration of the previous 7 days as a benchmark. For the last 24-hour trends, Insights selects the worst hourly P95 of the previous 24 hours as a benchmark.
P50 Duration
For P50 duration, Trends compares current duration with the median performance of the prior time window. For example, the last 30-day trends for P50 duration are calculated by taking the median of the daily P50 values as a benchmark.
Representations of trend data
This section describes how your trend data may appear across various metrics.
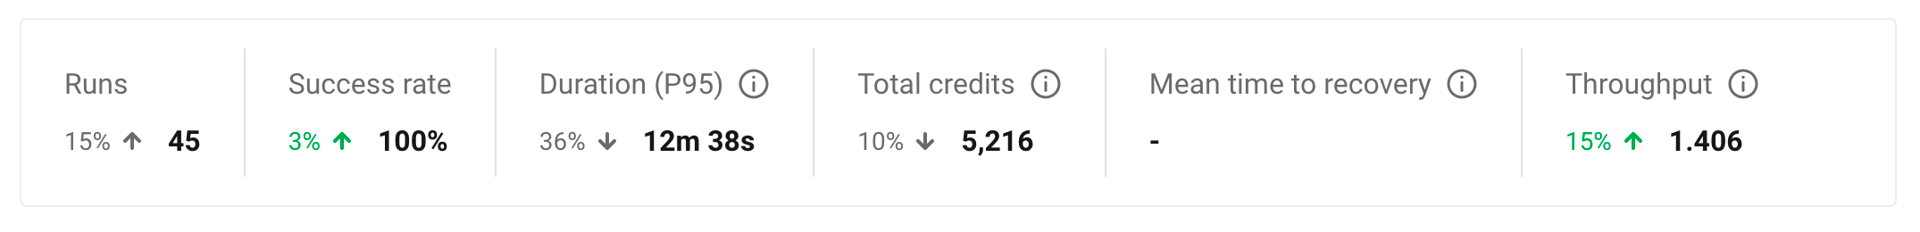
- Green: The metric is trending in the right direction.
- Red: The metric is trending in the wrong direction.
- Grey: A trend in either direction is not right or wrong.
Red and Green are used when describing the Success Rate, Throughput and MTTR metrics. Grey arrows are used when describing Runs, Duration and Total Credits
Percentages
Percentages indicate the relative percentage change for a metric in the selected time window compared to the prior window. For instance, if the success rate of a workflow in the last 7 days has increased to 60% from 40% in the prior 7 days, Trends displays the +50% change in the current time window.
Multiples
Multiples are used to indicate large swings in relative change over the selected period.
Arrows
Trend arrows with no values are used to indicate that the previous time window contains zero executions or no data.
No Trend Data
Empty trend values indicate that there has been no change in data between the two periods.