Using Insights
Overview
The CircleCI Insights dashboard provides an overview of the health and usage of your projects’ build processes, including time-series and aggregated data on credit usage, success rates, and pipeline duration.
Insights is not a financial reporting tool, and should not be used for precise credit reporting. Credit reporting from Insights does not use the same source of truth as the billing information that is found in the Plan Overview page in the CircleCI web app, nor does the underlying data have the same data accuracy guarantees as the billing information. This may lead to discrepancies between credits reported from Insights, and the billing information in the Plan Overview page. For precise credit reporting, always use the Plan Overview page in the CircleCI web app.
This document describes how to access and use the Insights dashboard on CircleCI cloud and server.
Usage
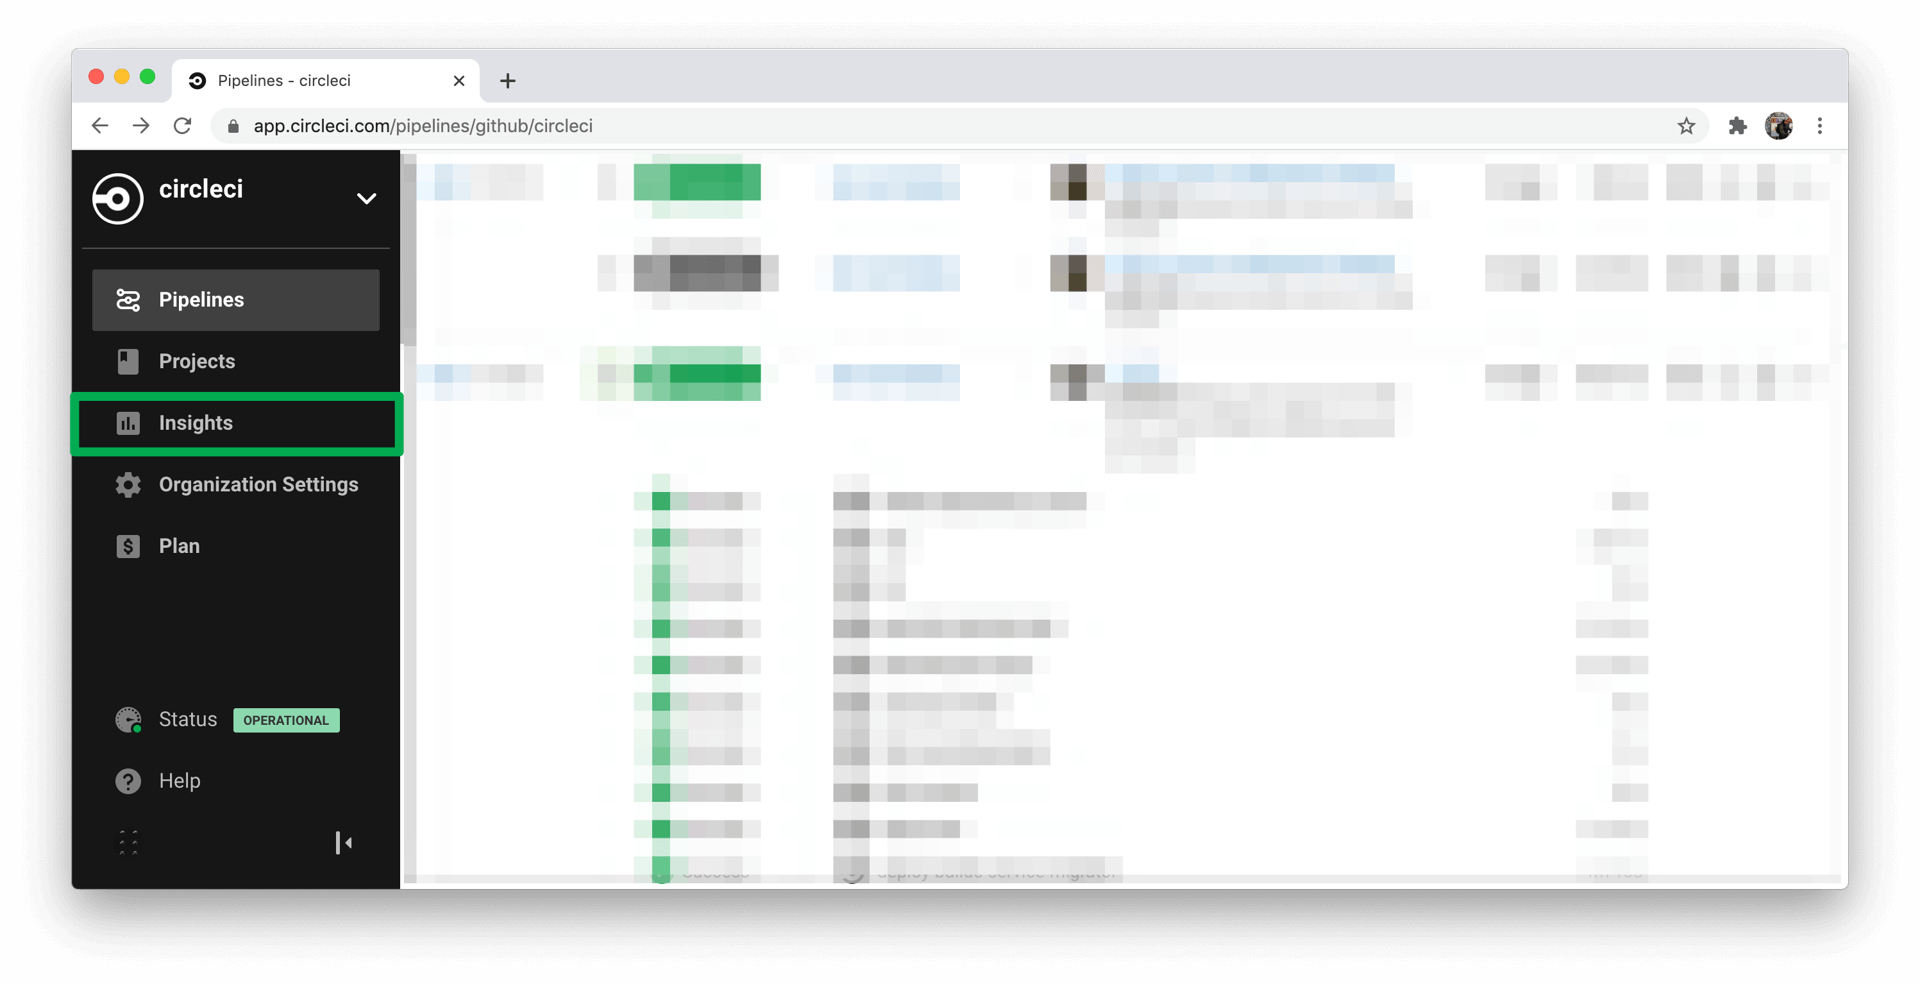
Insights across your organization can be accessed from the sidebar of the CircleCI web application.
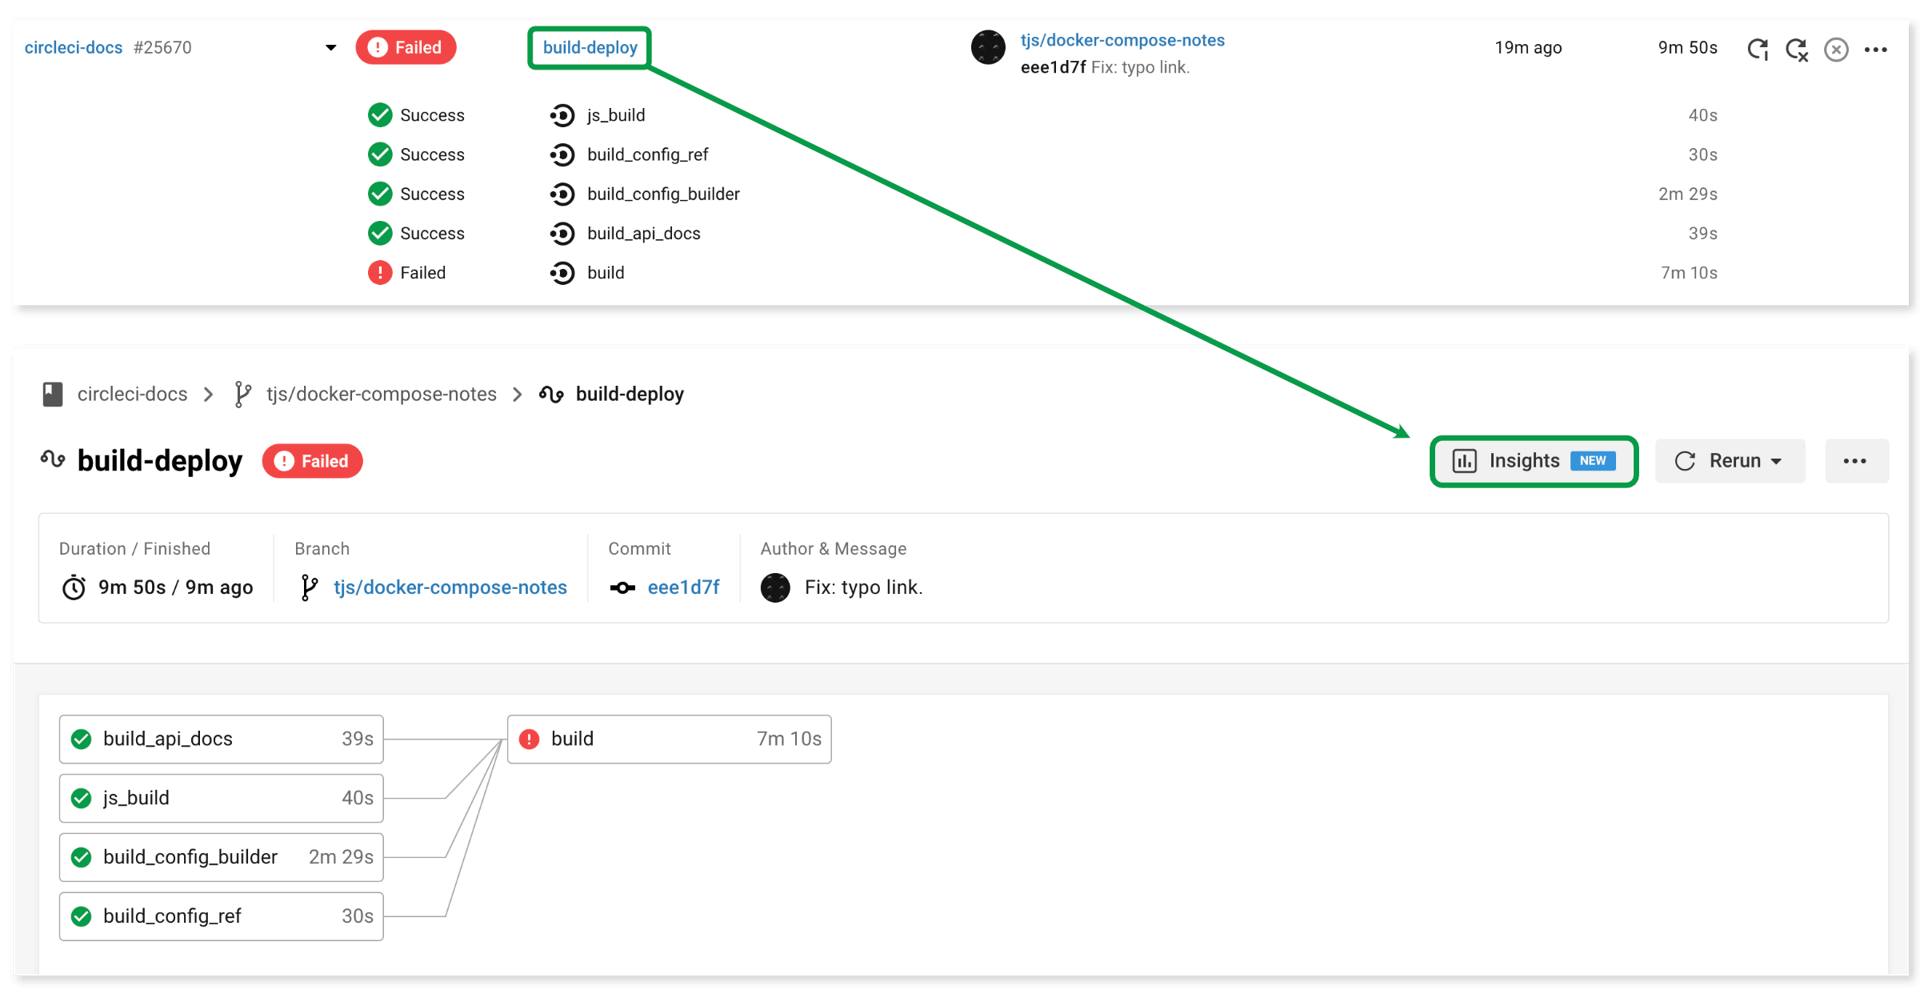
To access a specific project’s Insights, view a pipeline’s workflow and click the Insights button. Alternatively, you may access the Insights page by opening a pipeline’s Actions menu while viewing the pipelines dashboard.
Workflow overview
The Insights workflow overview provides metrics plotted over time for all branches, or a select branch, of a particular project workflow. The following data is charted under the workflow overview:
- Status (success versus failed) of up to 100 most recent workflow runs
- Workflow success rate
- Workflow duration (50th versus 95th percentile)
- Workflow credit usage
Job overview
Click the Jobs tab next to Overview to view the following cumulative data on a per-job basis:
- Total credits used
- Duration (95th percentile)
- Total runs
- Success rate
- Compute usage (average and max for CPU and RAM)
See also
Refer to the Collect Test Data document for guidance on configuring Insights into your most failed tests.


